

 Save
Save Print
Print[Ferro-Alloys.com] Jupiter Mines Limited Q3 FY2025 Quarterly Activities Report
Jupiter Mines Limited (ASX. JMS) (Jupiter or the Company), and together with its subsidiaries, the Group, is pleased to provide the following activities report for the quarter ended 31 March 2025.
Jupiter has a 49.9% beneficial interest in Tshipi é Ntle Manganese Mining Proprietary Limited (Tshipi), which operates the Tshipi Manganese Mine in the Kalahari manganese field. All Tshipi information is reported on a 100% basis (not based on Jupiter’s 49.9% economic interest).
|
Tshipi Highlights Sales of 777,229 tonnes (14% increase on previous quarter, 2% decrease on prior year corresponding period (PCP)), in line with full year plan |
|
Production of 858,152 tonnes (15% increase on previous quarter, 14% increase on PCP), in line with full year plan |
|
Cost of production US$2.06 per dmtu FOB (15% decrease on previous quarter, 7% decrease on PCP) |
|
One LTI in the quarter, TRIFR increased to 0.38 (last quarter 0.32) |
|
Tshipi earnings improved in the March 2025 quarter – EBITDA of A$44.3m (65% increase on previous quarter). Cash (A$130.5m) marginally reduced due to the interim dividend payment (8% decrease on previous quarter end) |
Q3 FY2025 Quarterly Activities Report: Summary The March 2025 quarter saw increased sales and production levels, with manganese prices improving during the quarter. Stockpile levels also increased during the quarter.
On-land logistics volumes increased during the quarter, with South African road haulage recommencing to meet export demand. No low grade ore was processed or sold for the period.
Tshipi EBITDA improved by 65% on the previous quarter, driven by a combination of higher realised manganese prices and increased sales volumes, as well as a decrease in the unit cost of production in the quarter. Cash decreased slightly after payment of the half-year dividend, but excluding this, Tshipi generated positive net cash for the quarter, notwithstanding increases in inventory and working capital during the quarter.
The March 2025 quarter saw average (realised) manganese prices (US$4.03/dmtu, CIF) that were 8% higher than the December 2024 quarter average (US$3.72/dmtu, CIF) as a result of steady ore demand, and moderated supply, resulting in low stocks of manganese ore at port in China.
The spot price at 31 March 2025 was US$4.27/dmtu (CIF). At the end of April 2025 the spot price is US$3.87/dmtu (CIF), 10% lower than the average seen during the March 2025 quarter.
Freight rates have slightly improved, to US$23.70 per tonne at the end of the March 2025 quarter (Port Elizabeth to Tianjin) compared with US$24.00 per tonne at the start of the March 2025 quarter (1% improvement).
Tshipi Manganese Mine
Key production, sales and financial information for Tshipi for the quarter ended 31 March 2025, and comparatives, are presented below:
|
Key Statistic |
Unit |
Q3 FY2025 |
Q2 FY2025 |
Q1 FY2025 |
YTD FY2025 |
Q3 FY2024 |
|
Production |
Tonnes |
858,152 |
745,167 |
1,211,890 |
2,815,209 |
749,598 |
|
Total sales |
Tonnes |
777,229 |
683,090 |
1,038,352 |
2,498,671 |
789,788 |
|
Average CIF price achieved (HGL) for sales concluded on a CIF basis 1 |
US$/dmtu |
4.03 |
3.72 |
4.28 |
4.04 |
3.55 |
|
Average FOB price achieved (HGL) for sales concluded on a FOB basis 1 |
US$/dmtu |
3.42 |
3.02 |
3.01 |
3.23 |
2.80 |
|
Average FOB cost of production |
US$/dmtu |
2.06 |
2.43 |
2.33 |
2.26 |
2.21 |
|
Earnings before interest, tax & depreciation (EBITDA) |
A$ million |
44.3 |
26.9 |
21.0 |
92.2 |
15.5 |
|
Net profit after tax (NPAT) |
A$ million |
28.3 |
17.2 |
13.7 |
59.2 |
10.4 |
|
Cash at bank |
A$ million |
130.5 |
141.4 |
96.8 |
130.5 |
70.3 |
1. Tshipi sells most of its ore on a CIF basis. See “Logistics and Sales” below for a full breakdown.
MINING AND PRODUCTION
|
bcm |
3,290,517 |
3,571,638 |
3,777,760 |
10,639,915 |
3,089,486 |
|
bcm |
235,076 |
283,142 |
273,052 |
791,270 |
154,398 |
|
Total |
|
3,525,593 |
3,854,780 |
4,050,812 |
11,431,185 |
3,243,884 |
|
Production |
|
|
|
|
|
|
|
Tonnes |
858,152 |
745,167 |
953,474 |
2,556,793 |
651,155 |
|
Tonnes |
- |
- |
258,416 |
258,416 |
98,443 |
|
Total |
|
858,152 |
745,167 |
1,211,890 |
2,815,209 |
749,598 |
|
Average FOB cost of production (HGL) |
US$/dmtu |
2.06 |
2.43 |
2.33 |
2.26 |
2.21 |
Mining of graded ore decreased 17% and waste decreased by 8% from the previous quarter. Mining volumes were impacted by heavy seasonal rain, with 18 days in total impacting performance. Mining of graded ore remained ahead of plan for the year to date period.
Tshipi high grade production increased by 15%, with healthy crushed ore stocks on hand at quarter end. No low grade ore was produced during the quarter.
Cost of production decreased 15% to US$2.06 on an FOB basis for the quarter. The main reason for this decrease was the extraction of ore from a new area in the pit, with a more favourable stripping ratio. Higher produced volumes in the quarter, also benefitted unit costs. The weakening of the South African Rand against the US Dollar during the quarter also yielded a benefit to the US Dollar unit rate.
LOGISTICS AND SALES
|
|
Unit |
Q3 FY2025 |
Q2 FY2025 |
Q1 FY2025 |
YTD FY2025 |
Q3 FY2024 |
|
On-land logistics |
Tonnes |
885,997 |
703,360 |
977,261 |
2,566,618 |
730,660 |
|
Sales |
|
|
|
|
|
|
|
Tonnes |
599,102 |
559,090 |
914,074 |
2,072,266 |
598,085 |
|
Tonnes |
178,127 |
124,000 |
115,335 |
417,462 |
147,797 |
|
Tonnes |
- |
- |
8,943 |
8,943 |
43,906 |
|
Total |
|
777,229 |
683,090 |
1,038,352 |
2,498,671 |
789,788 |
|
Average CIF price achieved (HGL) |
US$/dmtu |
4.03 |
3.72 |
4.28 |
4.04 |
3.55 |
|
Average FOB price achieved (HGL) |
US$/dmtu |
3.42 |
3.02 |
3.01 |
3.23 |
2.80 |
Logistics volumes increased by 26% for the quarter, with South African road haulage recommencing during the quarter to meet increased export demand.
Sales volumes increased in the quarter by 14%, notwithstanding derailments on the ore corridor. Year to date sales remain on track 3.4 million tonnes exported for FY2025 (in line with Tshipi’s historical average).
Marketing and Marketing Outlook
JUPITER MARKETING
Sales and financial information for Jupiter’s marketing entity for the quarter ended 31 March 2025, as well as comparatives, are presented below.
The prices shown below relate to the prices realised by Jupiter’s marketing team for the 49.9% share of Tshipi sales that are marketed by Jupiter.
|
|
Unit |
Q3 FY2025 |
Q2 FY2025 |
Q1 FY2025 |
YTD FY2025 |
Q3 FY2024 |
|
Sales |
Tonnes |
379,409 |
359,715 |
535,018 |
1,274,142 |
392,073 |
|
Average CIF price achieved (HGL) for sales concluded on a CIF basis |
US$/dmtu |
4.14 |
3.72 |
4.34 |
4.09 |
3.54 |
|
Average FOB price achieved (HGL) for sales concluded on a FOB basis |
US$/dmtu |
3.55 |
3.04 |
3.04 |
3.27 |
2.81 |
|
Marketing fee income |
A$ million |
2.3 |
1.9 |
2.5 |
6.7 |
1.7 |
|
EBITDA |
A$ million |
2.1 |
1.7 |
2.3 |
6.1 |
1.5 |
|
NPAT |
A$ million |
1.5 |
1.5 |
1.6 |
4.6 |
1.2 |
|
Cash at bank |
A$ million |
2.4 |
3.7 |
2.2 |
2.4 |
2.8 |
MARKET COMMENTARY AND OUTLOOK
Seaborne manganese ore prices showed an upward trend through most of Q3 FY25, before declining late in the period. The Fastmarkets manganese ore semi carbonate index (36.5% Mn CIF Tianjin) was quoted at US$4.27/dmtu on 28 March 2025 compared to US$3.96/dmtu on 27 December 2024, with the index reaching a high of US$4.49/dmtu during the period.
Manganese ore prices in the quarter were largely supported by supply side factors, with exports from major regions decreasing at the end of calendar year 2024 and into 2025, in response to lower manganese ore prices (during the December 2024 quarter).
Reduced exports into China through this period, compared to preceding months, was the main contributor to the reduction in manganese ore stocks at major ports in China, which reduced from 5.1 million tonnes at the beginning of the quarter to 3.6 million tonnes at the end of the quarter, as quoted by FerroalloyNet. Consumption of manganese ore during the quarter has also assisted in reducing manganese ore stocks, as manganese alloy production has continued at robust levels notwithstanding an absence of growth in alloy demand.
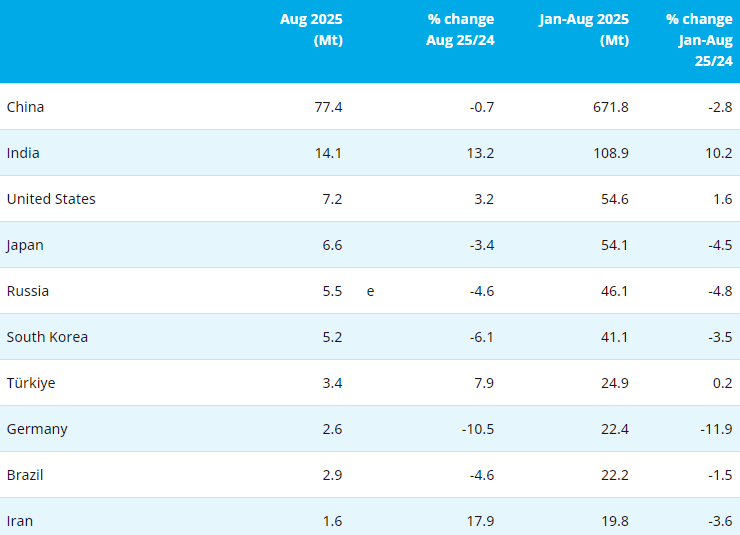
The Worldsteel Association has reported global crude steel production to have declined by 1% in Q3 FY25 compared to Q3 FY24, with production gradually improving through the quarter. A larger decline of 3% in China has been offset by a modest gain of 1% in countries outside China.
Exports of steel products from China are reported to have risen in Q3 FY25 on a year-on-year comparative basis amid a slowdown in domestic demand and are rumoured to have maintained their momentum ahead of more intensive tariff and protectionist measures from various regions.
Manganese alloy plants have continued to face weak demand from steel mills, which has particularly impacted long steel products such as reinforcing bar. Depressed real estate and construction industries in China has continued to impact demand in China. Above average levels of manganese alloy stocks along the supply chain have also pressured plant margins during the quarter. Due to this, some plants in China have announced curtailments, with April 2025 manganese alloy production in the region expected to be lower on a month-on-month comparative basis.
These downstream demand factors have influenced the manganese ore market towards the end of the quarter and into Q4 FY25. Escalating trade tensions and related currency movements have also been negative for market sentiment.
On the supply side, closer to the end of Q3 FY25 and into Q4 FY25, manganese ore exports from main producing countries have generally shown an increasing trend. Exports have not reached the levels seen in mid-2024 but are sufficient to lead to an increase in Chinese stockpiles from those seen at the end of the quarter, in the short term. It is noted that Chinese stockpiles are currently significantly below average levels currently.
More broadly, the International Monetary Fund (IMF) has recently released an update to their World Economic Outlook, previously published in January 2025. The organisation has revised down their global growth projections for 2025 to 2.8% and for 2026 to 3.0%, a downgrade of 0.5% and 0.3%, respectively. Growth forecasts for the United States and China have also been downgraded over this period. The IMF has cited heightened uncertainty and unpredictability, particularly over tariff announcements, being a downside risk to global growth. Conversely, the Chinese National People’s Congress meeting, in March 2025, announced that China’s growth target for 2025 would be kept the same as last year (at around 5%).
|
Key market prices |
Unit |
Today (end Apr 2025) |
% change since 31 Mar 2025 |
31 Mar 2025 |
31 Dec 2024 |
30 Sep 2024 |
30 Jun 2024 |
31 Mar 2024 |
|
Mn ore 37% FOB Port Elizabeth |
US$/dmtu |
3.23 |
(11%) |
3.62 |
3.30 |
3.00 |
4.82 |
3.04 |
|
Freight rate Port Elizabeth to Tianjin (estimate) |
US$/dmtu |
22.90 |
(3%) |
23.70 |
24.00 |
26.80 |
30.60 |
33.30 |
|
Total stock at Chinese ports |
‘000 tonnes |
3,751 |
4% |
3,600 |
5,179 |
5,973 |
5,071 |
5,781 |
Invitation forThe 21st China Ferro-Alloys International Conference

- [Editor:tianyawei]
 Daily News
 Research
 Magazine
 Company Database
 Customized Database
 Conferences
 Advertisement
 Trade
Trade


 Online inquiry
 Contact

Tell Us What You Think